PedX: ML Pipeline
Direct responsibilities:
End-to-end system architecture, ML pipeline development, Computer vision integration, 3D visualization design.
Hands-on contributions:
PedX-Crawler service, PedX-Visualizer web application, PostgreSQL data architecture, Interactive 3D globe interface.
About the project:
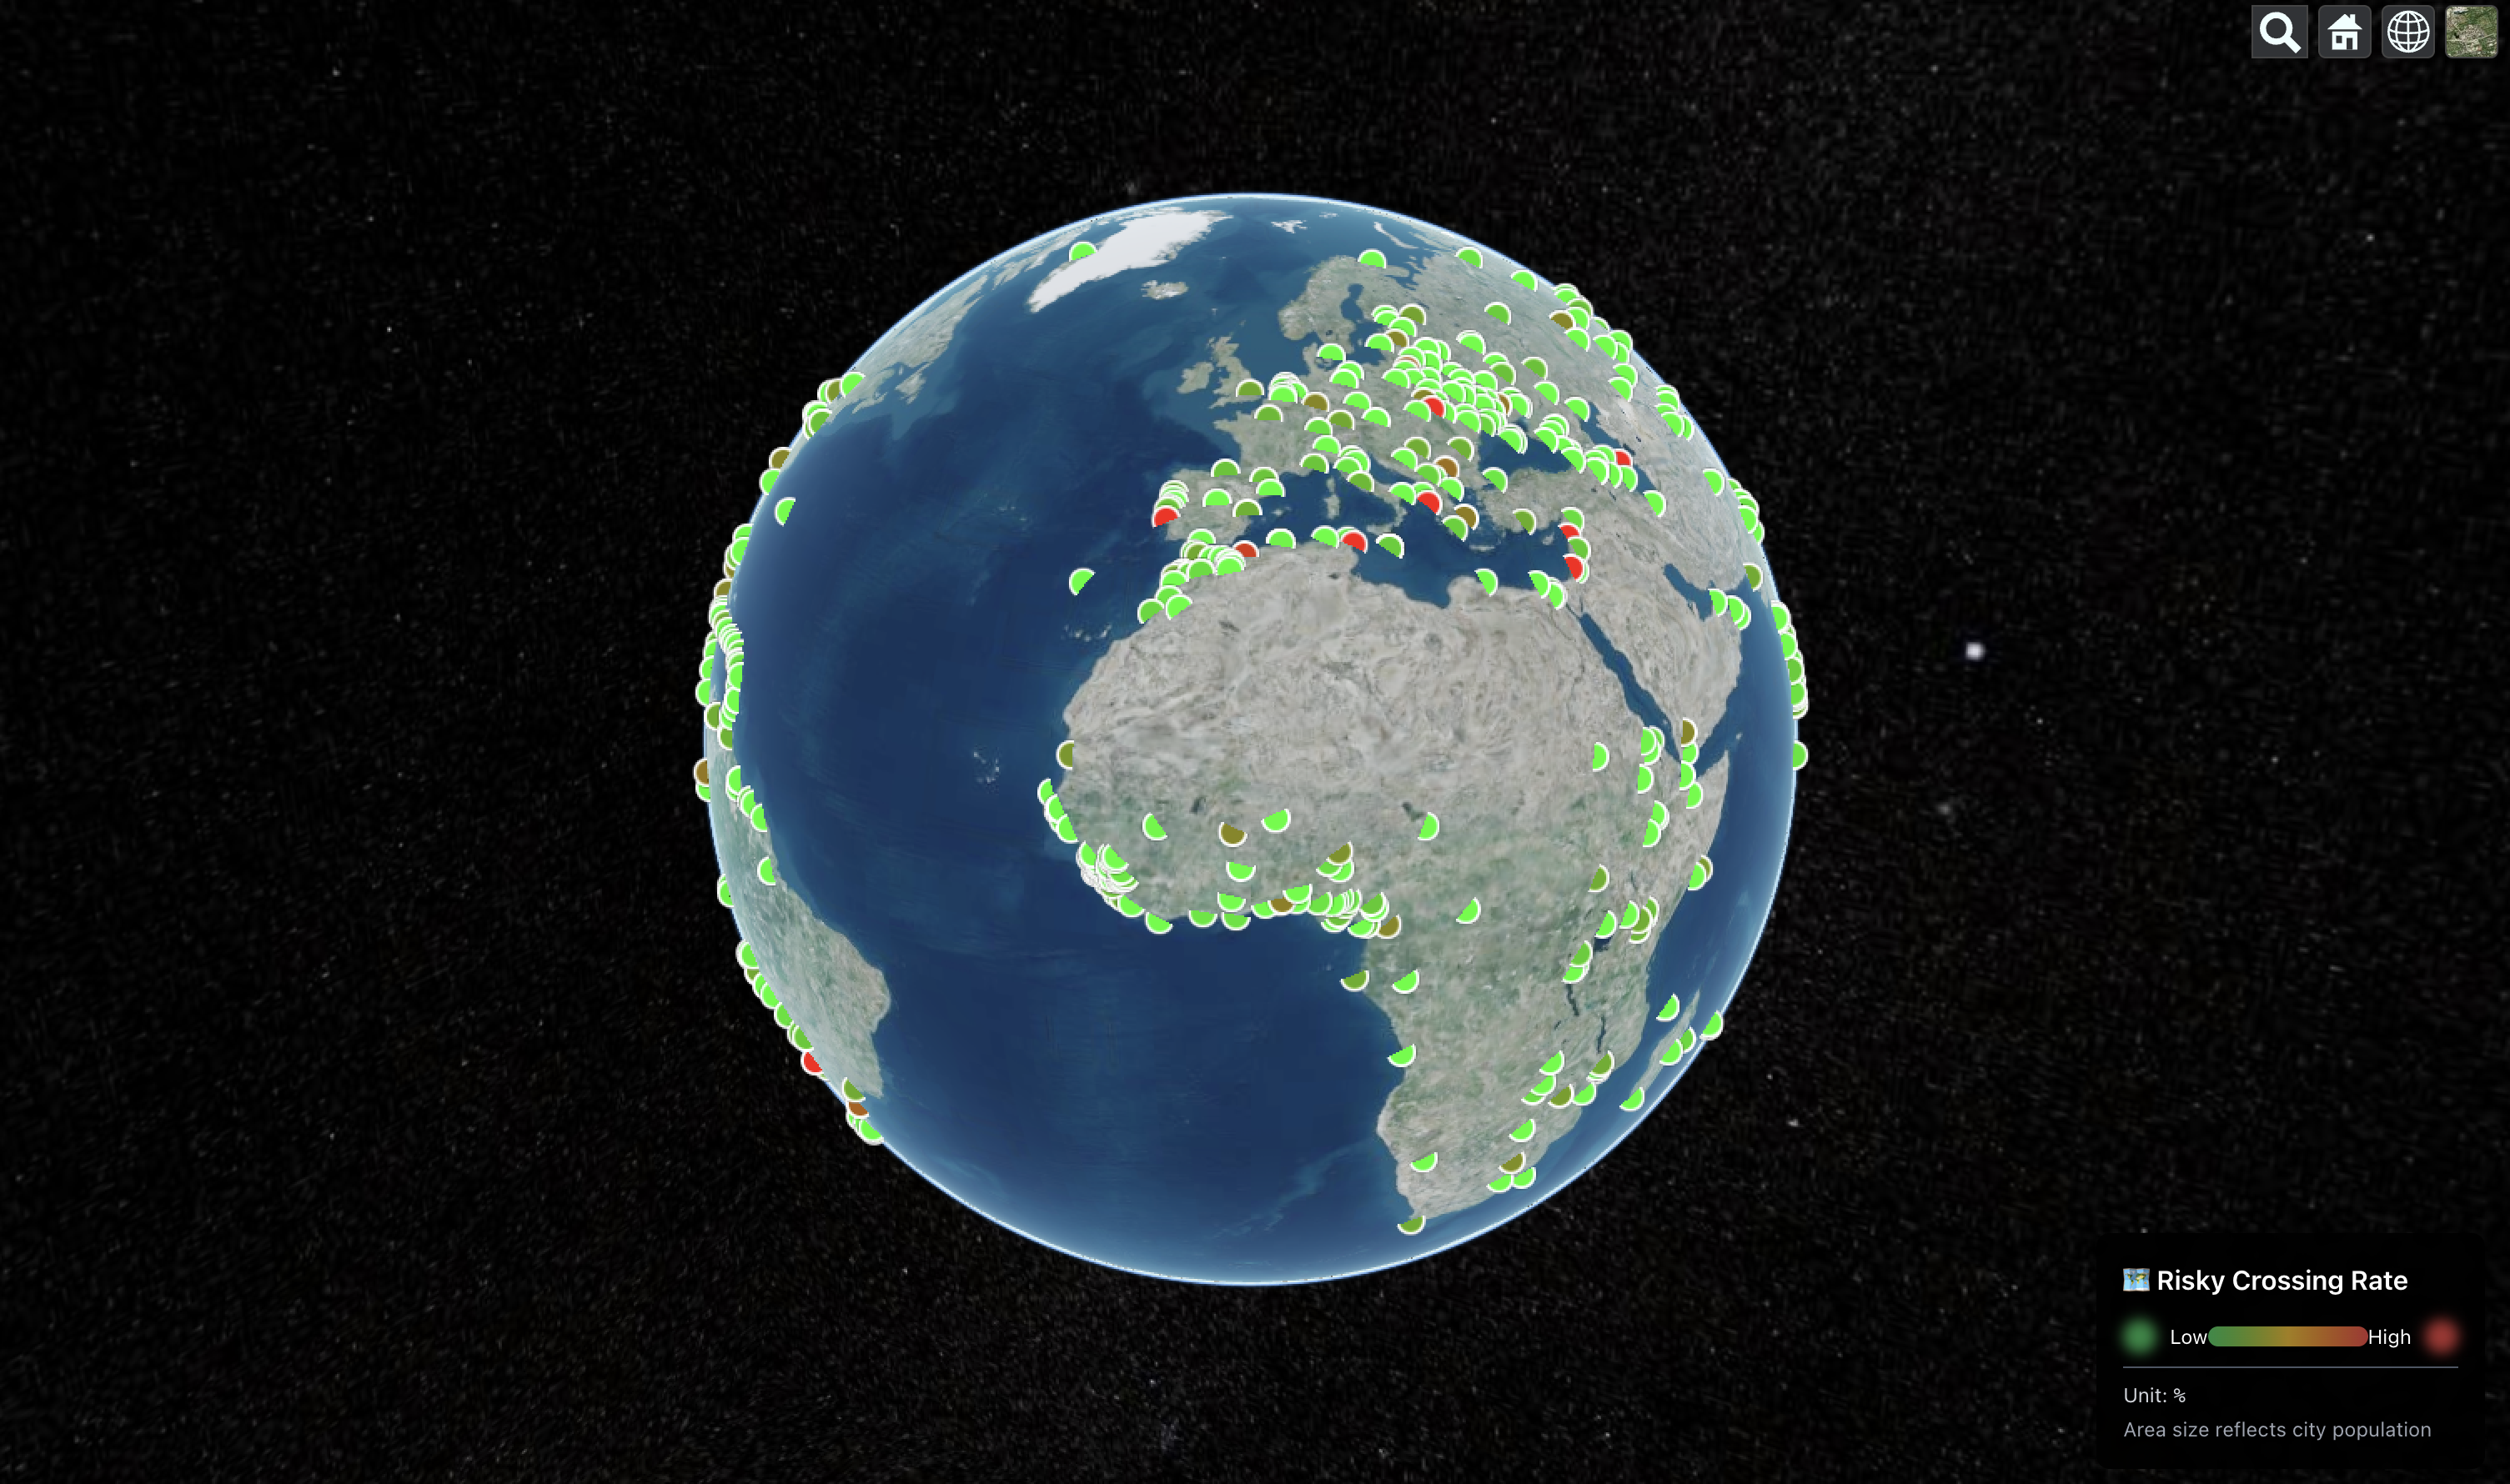
An end-to-end ML research system that discovers, analyzes, and visualizes pedestrian street-crossing behavior globally. The pipeline connects video discovery, computer vision analysis, and interactive 3D visualization to transform raw street footage into actionable geospatial insights for urban planners.
PedX-Pipeline is an end-to-end system that discovers, analyses, and visualises pedestrian street-crossing behaviour around the world. The project combines strong technical ML research with thoughtful UX design to create a repeatable pipeline from raw video to actionable geospatial insights.
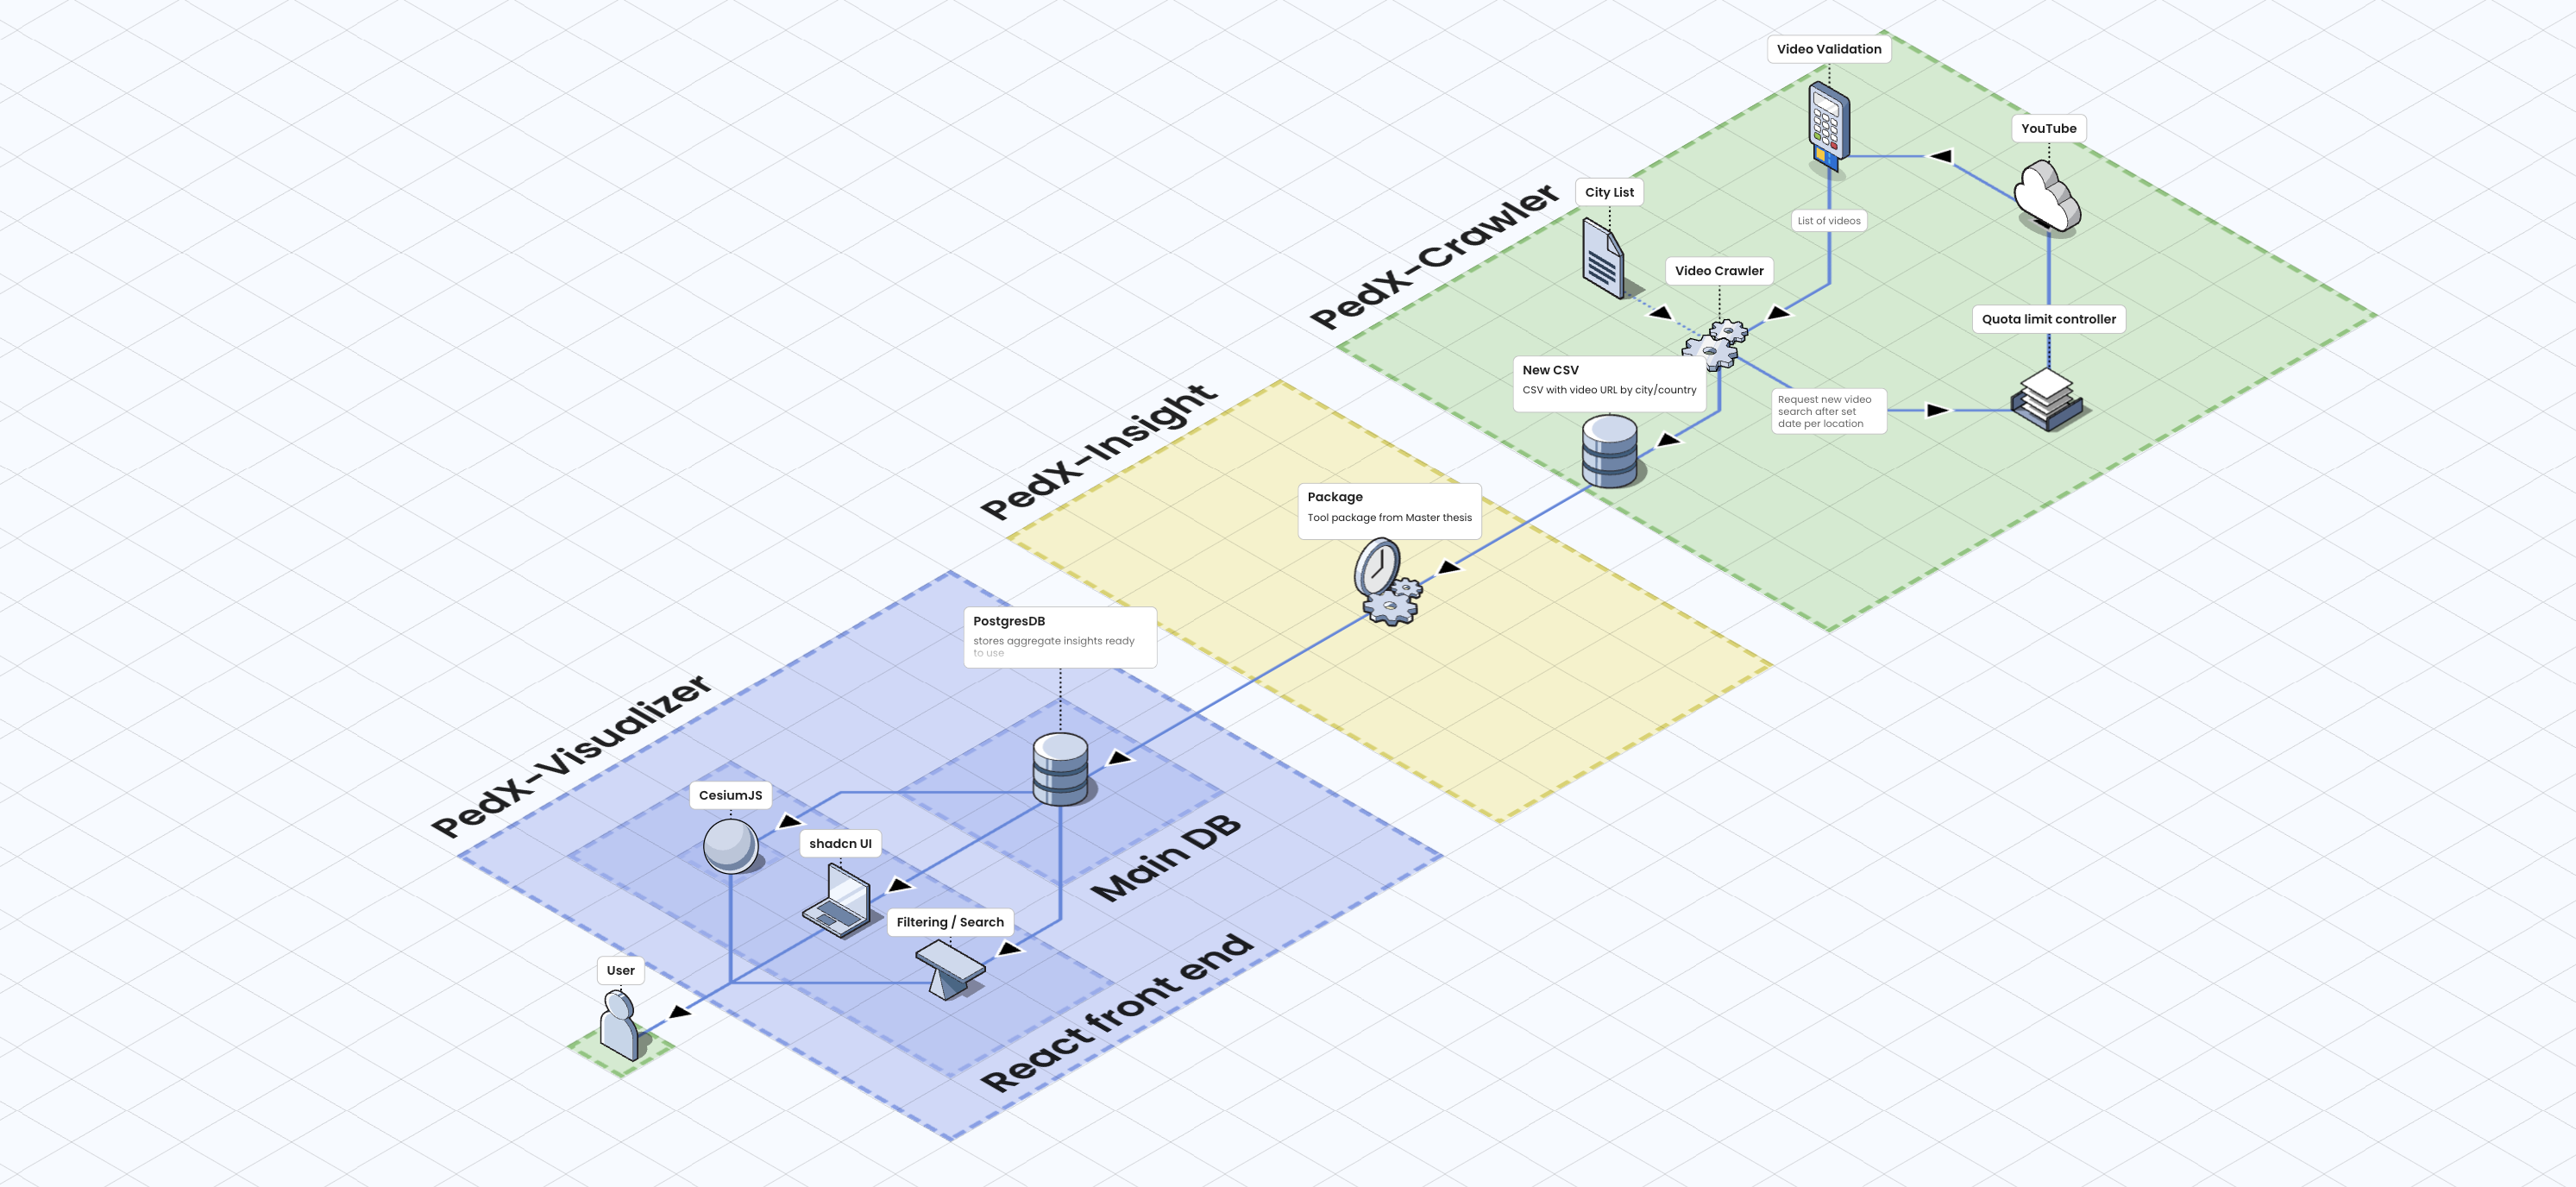
System Architecture
The pipeline connects three integrated services that work together to transform public video data into research insights:
PedX-Crawler: A Python-based service that automatically discovers and registers high-quality videos of street crossings from public sources like YouTube. The crawler searches by city and keywords, collects metadata (video URL, channel, location), and stores structured data in CSV format for downstream processing.
PedX-Insight: An existing Python toolkit that processes collected videos using YOLO detection models. This service runs computer vision analysis to extract structured insights about pedestrian behavior—crossing speeds, wait times, crossing distances, and safety patterns—producing CSV and database outputs.
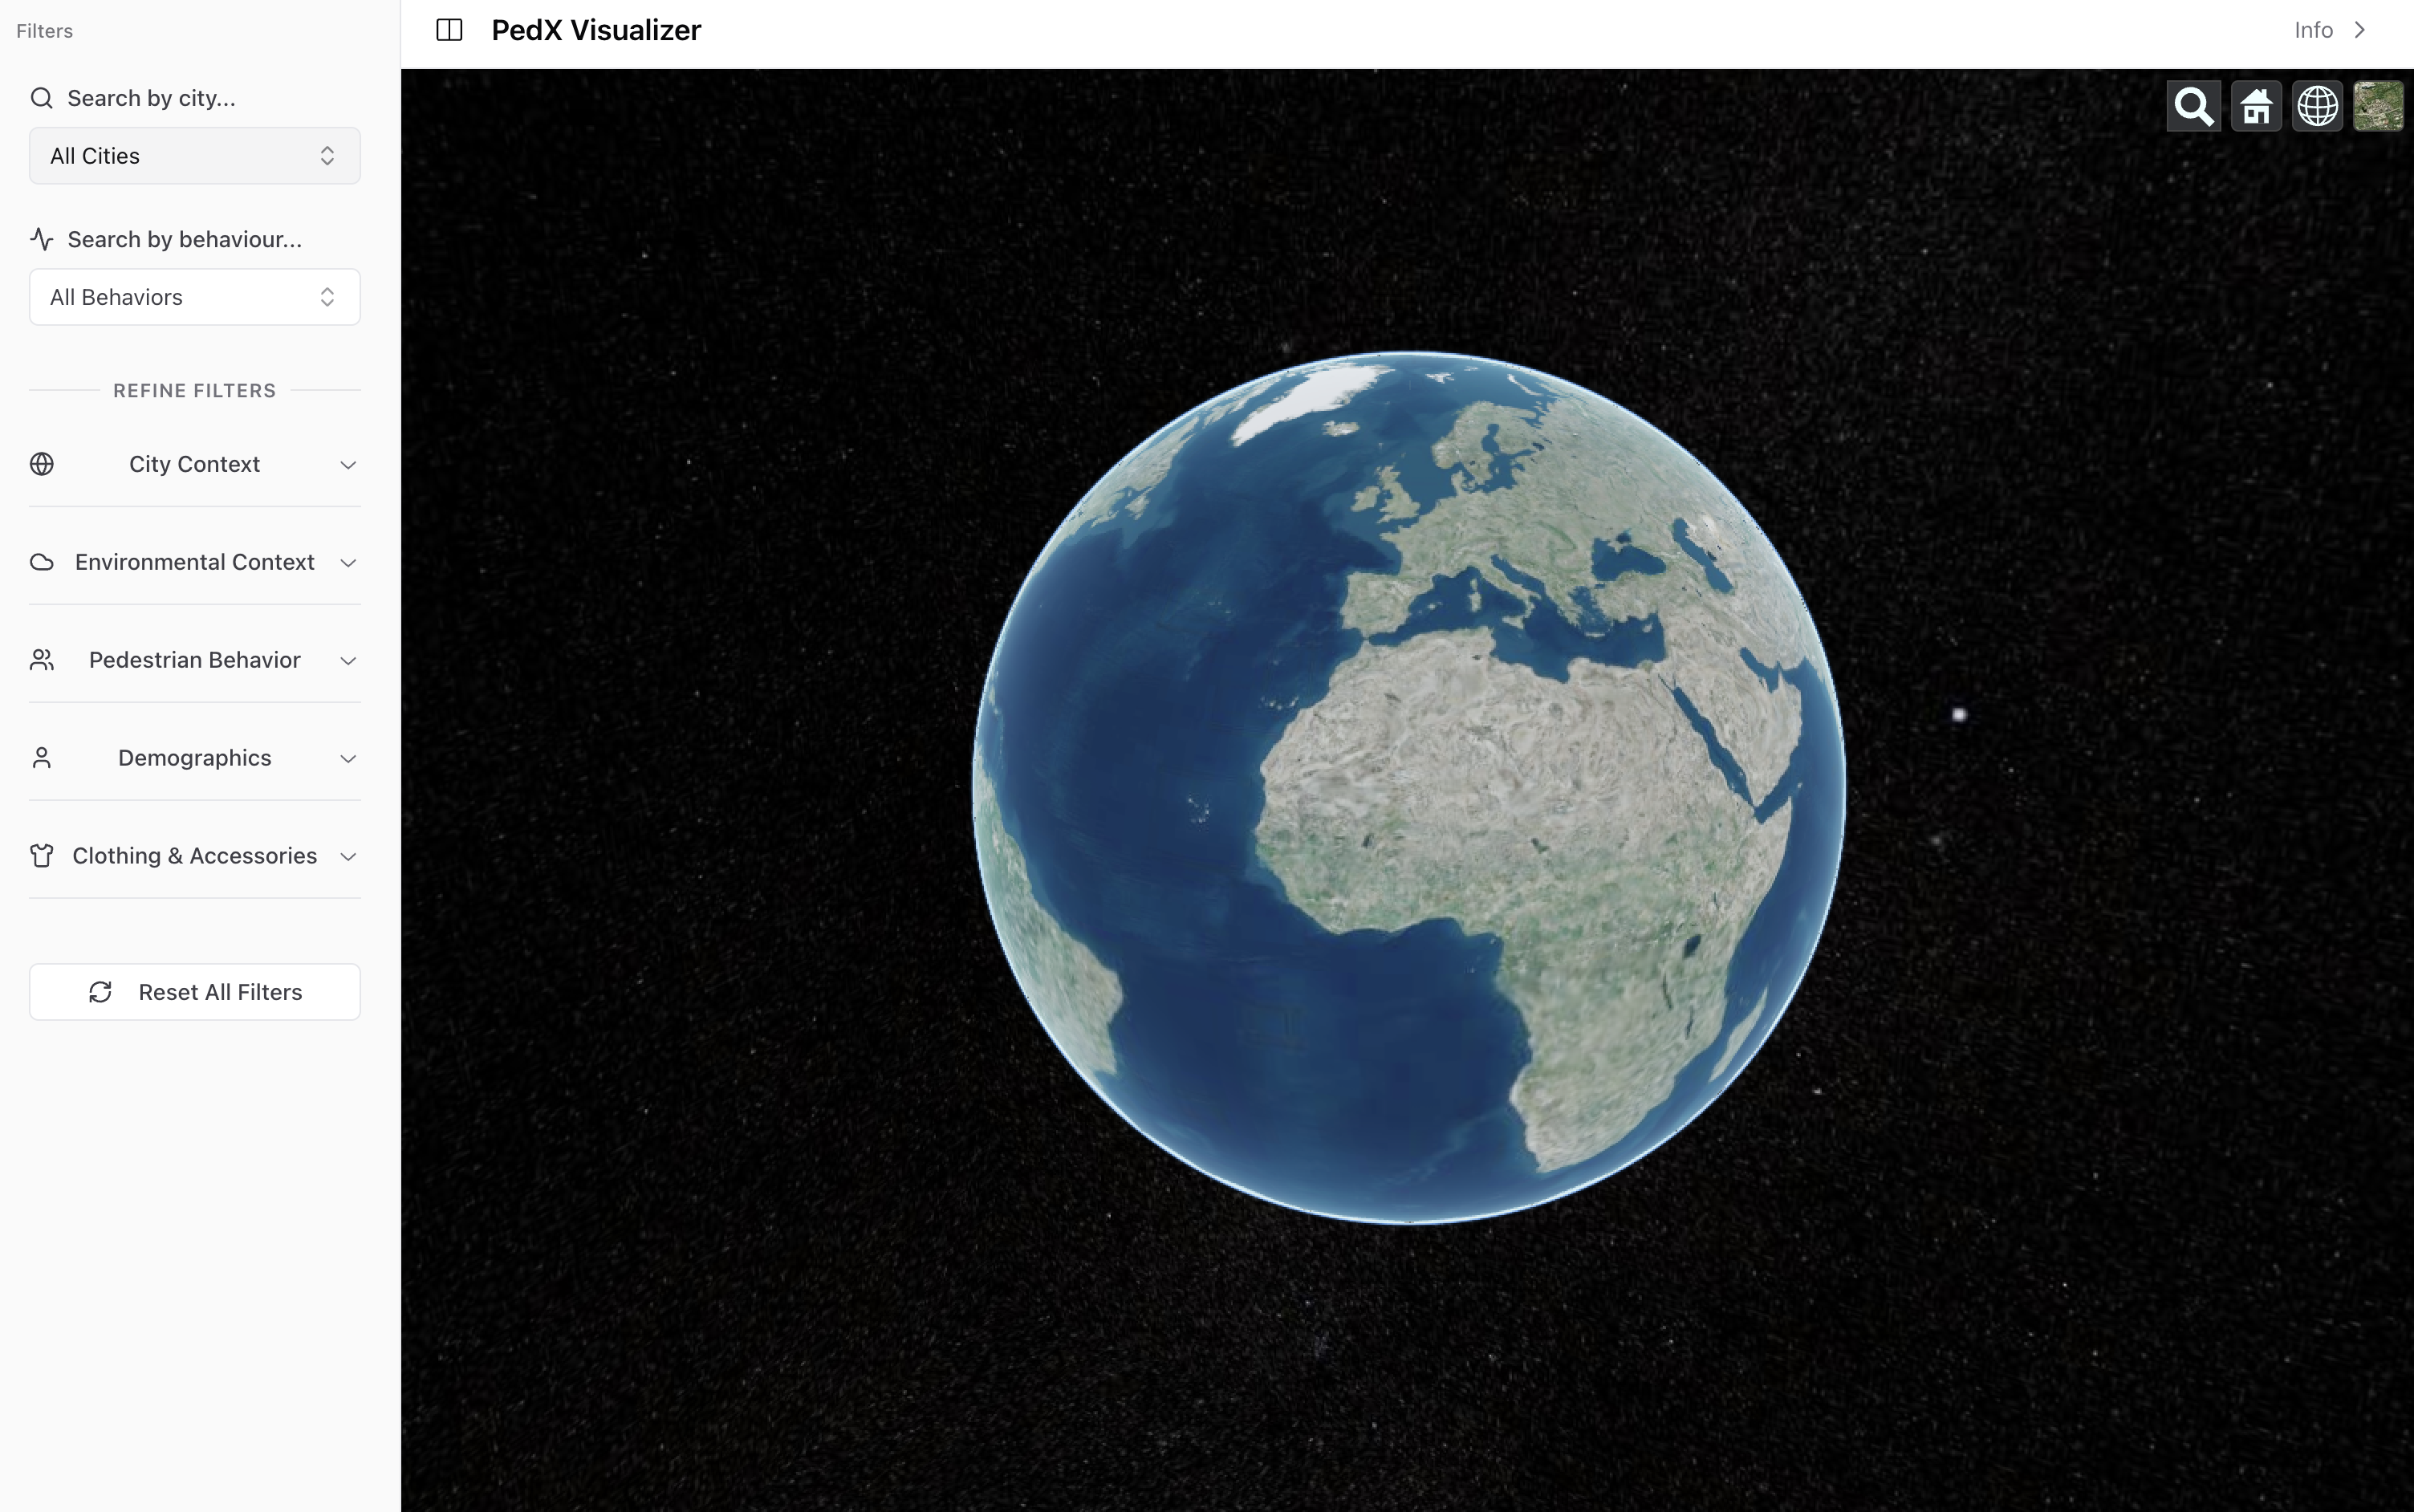
PedX-Visualizer: A performant web application built with React, shadcn/ui, and CesiumJS that presents analyzed data on an interactive 3D world map. Users navigate the globe, zoom into cities, filter results by multiple attributes, and explore crossing insights enriched with metadata.
Technical Implementation
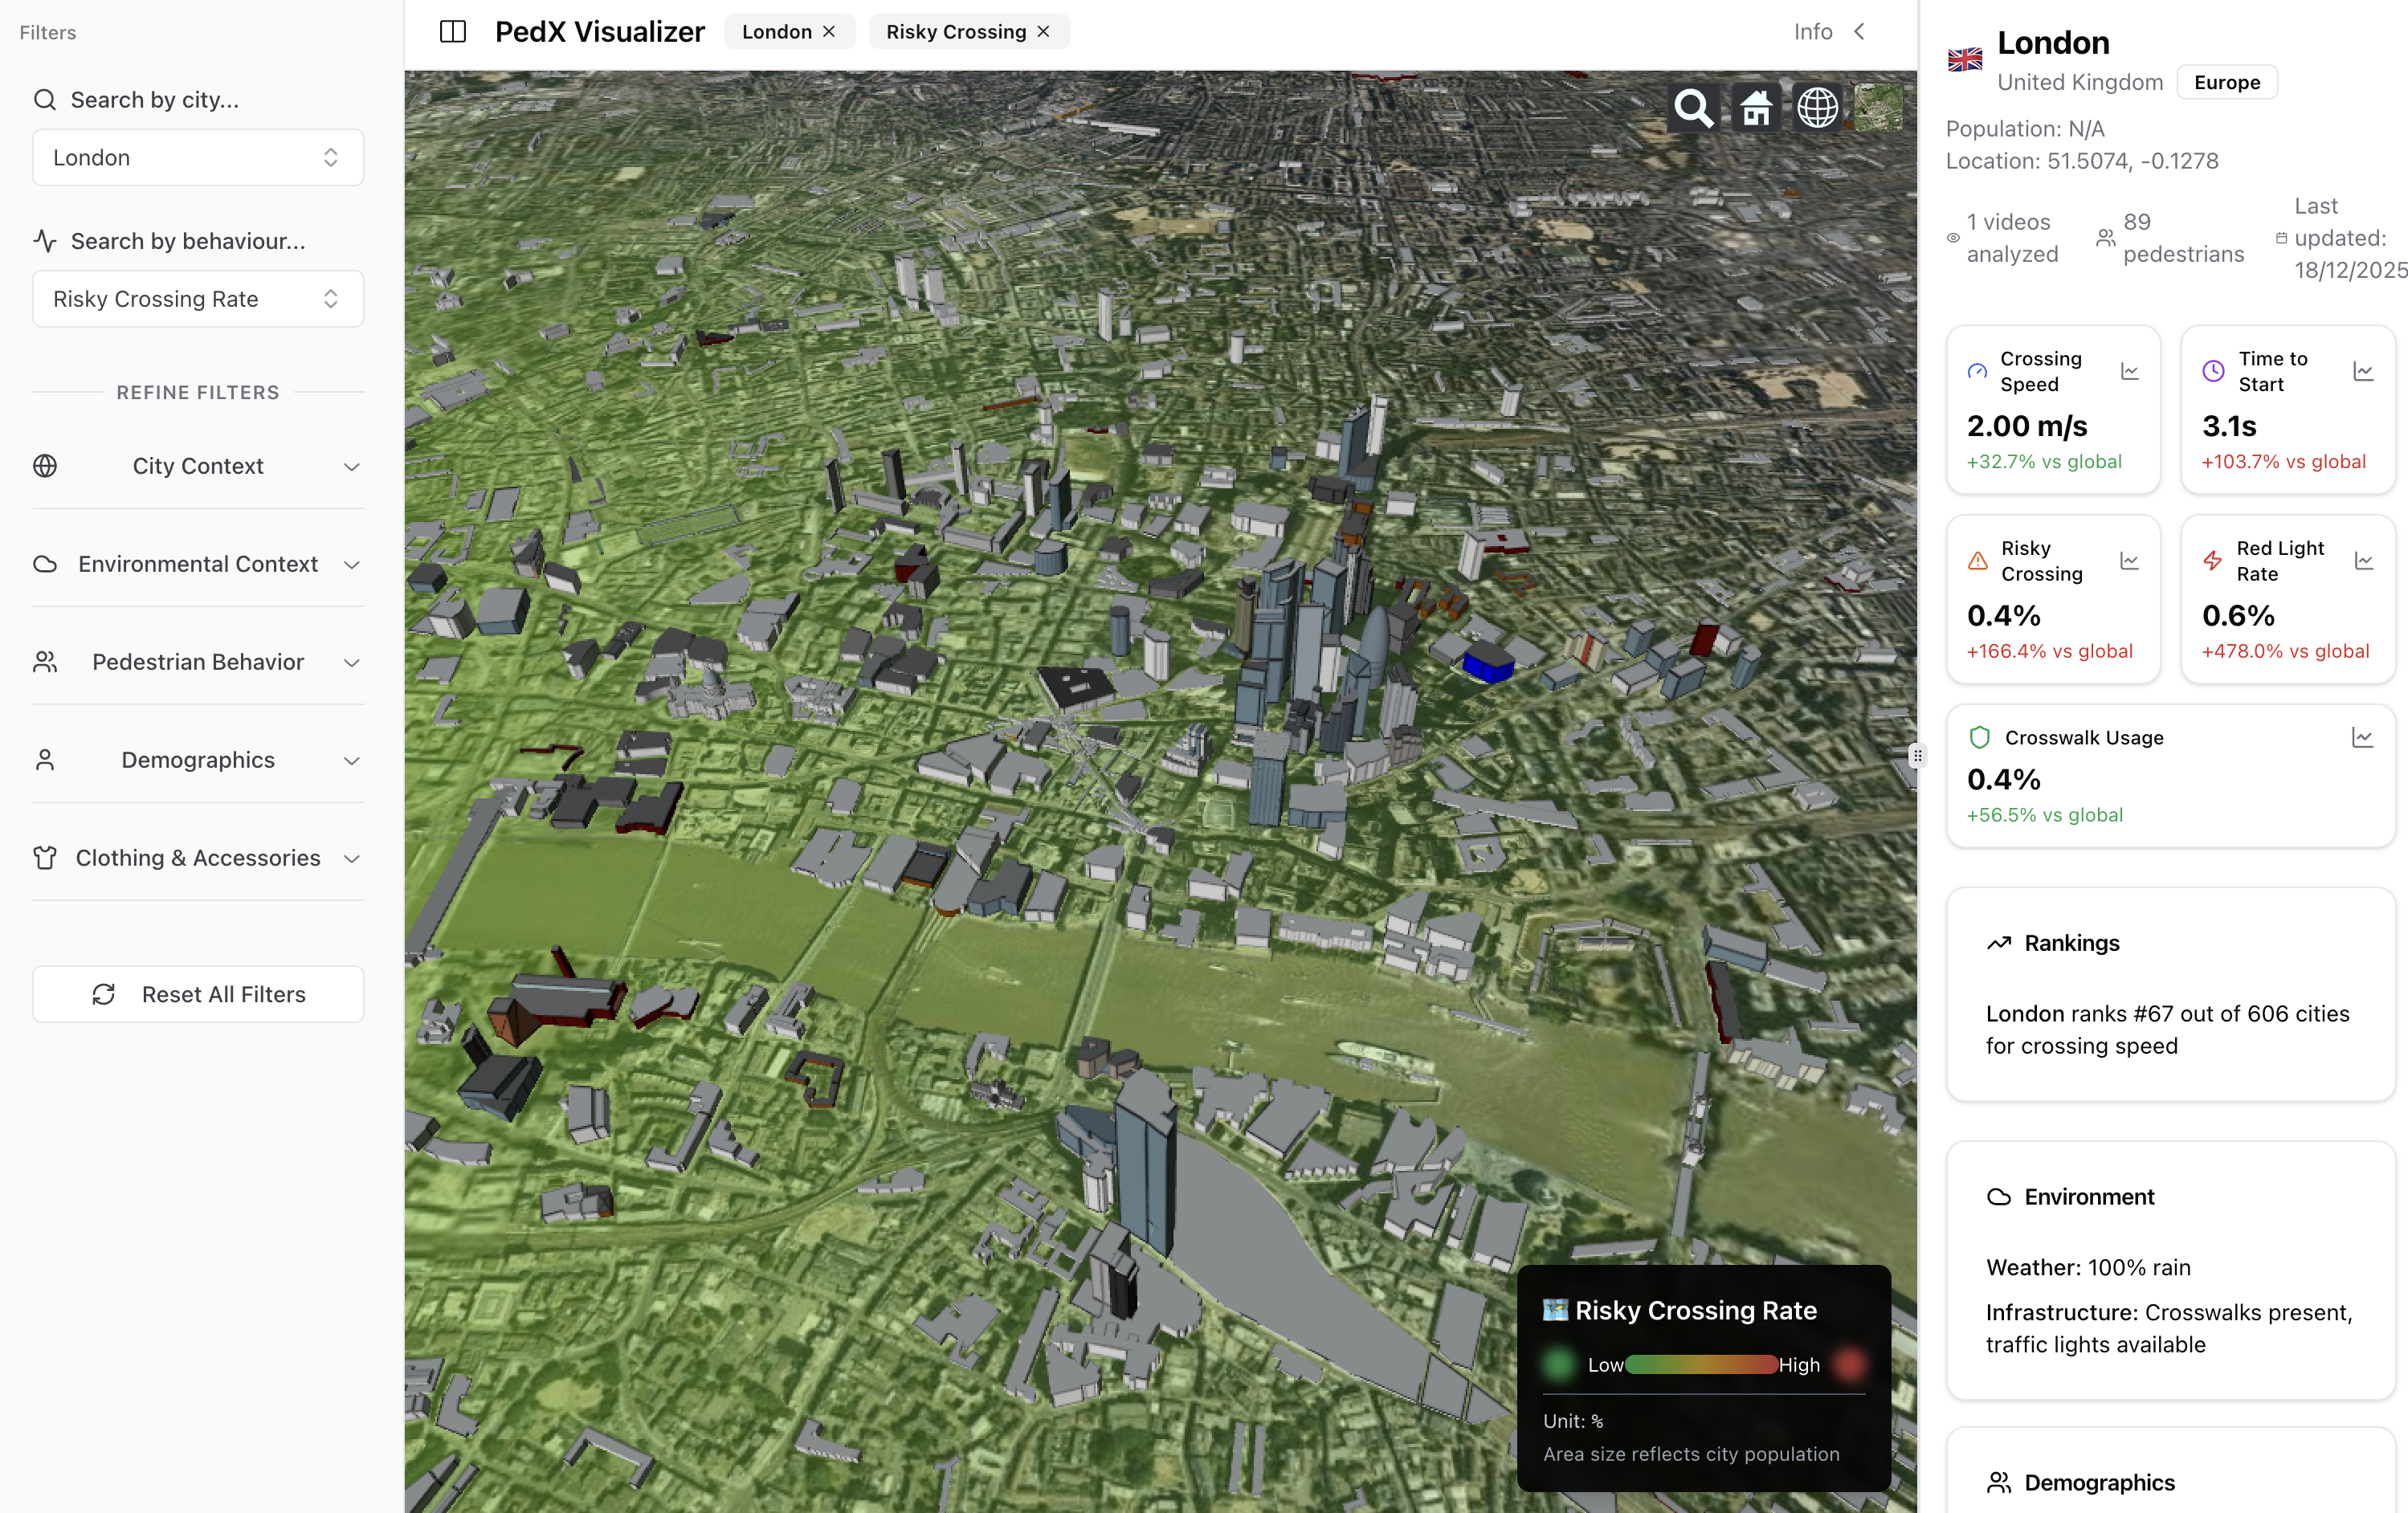
The system is built on a robust technical stack designed for scalability and performance. The backend uses PostgreSQL (hosted on Supabase/Neon DB) with a carefully designed schema that separates raw data from precomputed insights. The main table (CoreGlobalCrossingData) holds one row per city with core metrics: crossing speed (avg, median, min, max), time to start crossing, waiting time, and crossing distance, along with geographic coordinates and metadata.
On top of the base table, we created database views to precompute insights once and serve them fast to the application. CityInsight views provide everything about a selected city for the right-hand info panel, while MetricInsight views generate leaderboards and statistics for specific metrics (e.g., 'Top cities by crossing speed'). A column registry and filters view enable automatic filter generation in the UI when new metrics are added, making the system future-proof without requiring code changes.
The frontend leverages CesiumJS for high-performance 3D globe rendering, allowing smooth navigation and interaction with thousands of data points. React and shadcn/ui provide a modern, accessible interface for filtering, searching, and exploring the data.
ML Research & Computer Vision
At the core of PedX-Insight is sophisticated computer vision research using YOLO detection models to analyze pedestrian behavior in street videos. The system extracts multiple behavioral metrics: average and median crossing speeds, time to start crossing, waiting times, and crossing distances. Each metric is calculated with statistical rigor, providing confidence levels based on sample size.
The ML pipeline processes videos from diverse global sources, handling variations in lighting, camera angles, and environmental conditions. This requires robust model training and careful validation to ensure consistent results across different video qualities and geographic contexts.
UX Design & Interaction
The user experience centers on an interactive 3D globe that makes geographic patterns immediately visible. Urban planners can explore crossing speeds, safety behaviors, and infrastructure usage across different cities, filtering by demographics, weather conditions, and time of day. The interface balances information density with clarity, allowing both high-level exploration and detailed city-specific analysis.
The filtering system enables users to drill down from global patterns to specific behavioral nuances in a single city. Real-time updates and smooth interactions make the complex dataset feel approachable, even for users without technical backgrounds.
Impact & Achievements
The PedX-Pipeline demonstrates how computer vision and thoughtful interface design can democratize urban research. The system reveals patterns invisible in traditional studies: how crossing speeds vary between cities, which infrastructure designs reduce risky behavior, and how environmental factors affect pedestrian decisions. These insights directly inform safer street design and urban planning decisions.
By creating a repeatable pipeline from video discovery to visualization, the project enables scalable analysis of pedestrian behavior at a global scale. The architecture supports future expansion with new metrics and analysis methods, making it a sustainable research tool for ongoing urban safety research.